Total betting is form of wagering where the bookmaker predicts the number of points scored and then offers the betting options over the posted total and under the posted total. In some cases total betting is offered as multiple-way market such as 0-1 goals, 2 goals, 3-4 and 5+ goals with unique odds for each option. While certain betting sites also offer team totals, the most common market is over/under betting on the total both teams combine to score in a match.
For football and basketball over/under wagers are generally 50/50 propositions and all bookmakers charge commission known as VIG (this is their profit margin and is how betting companies make money). With most you can bet over or under at -110 (risk 11 to win 10) but some offer reduced juice such as -105 (risk $10.50 to win $10). For sports where there are less scores per game one outcome is often more likely than the other. In baseball you might see over 7 -140 (risk 14 to win $10) / under 7 +120 (risk $10 to win $12). In this case if the game scored exactly 7 all wagers are refunded. When a half point is used such as 7.5 this means a tie is not possible.
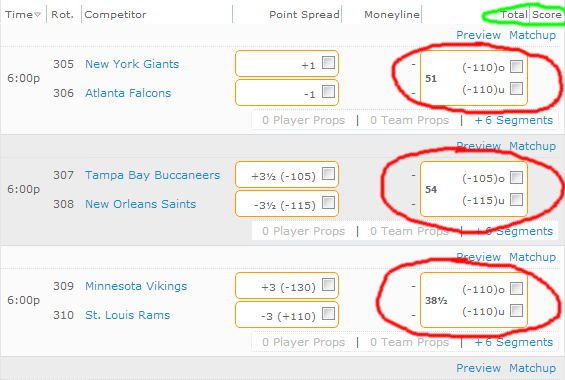
An NFL betting card at popular sportsbook Bovada showing 3 games with over/under totals of 51, 54 and 38.5
Total Betting Strategy
If you’ve come to this article looking for the golden keys to handicapping total goals for any sport, I’ll warn you upfront you’re not going to find this here. In fact, to save you the effort searching… read my article the evolution of sports betting to understand betting is a market and there is no incentive for anyone talented to share an “exact how to” for betting any sport. That said I will help you get started in the right direction.
Soccer Handicapping Totals
At the time I’m writing this article the NHL is on lockout, MLB is in the offseason, and NBA is still too young in the season to give me an easy example. As NFL football is a different beast, I’m going to use soccer to give you a rough idea how to handicap total points scored. I’ll walk you through my full logic.
The league I decided to handicap is the English Premier League where most teams have played 14 games on the season so far, while two have played 13. That’s a total of 139 games played. The first thing I did was Google: EPL table to find 384 goals have been scored so far this season. That breaks down to each team scoring an average of 1.38 goals per game. I decide now to look into a match between Chelsea and West Ham.
In 14 games this season Chelsea has scored 24 goals, which is 1.71 per game. However their median number of goals scores falls at 1.5. They have scored over this number 7 times and under it 7 times this season. Their last 5 games have all been under as well – specifically 1,1,1,0,0. In this situation using the 1.5 median is better than using the 1.71 mean. I also see they’ve given up 13 goals in 14 games this season and nothing suggests the mean is inaccurate so call it 0.93 goals allowed per game. West Ham has scored 16 goals on the season for 1.14 per game. However in 11 of 14 games they scored 1 or 0 goals, and have went 1 or less in the past 6 straight. Again the median figure is more accurate which is 1 goal scored per game. They’ve given up 16 goals on the season and this 1.14 goals allowed per game figure appears to be a safe figure to use.
This gives me goals scored / goals allowed figures to work with of:
- Chelsea: 1.50 / 1.14
- West Ham: 1 / 1.14
As the league average is 1.38 goals I need to calculate offense and defense ratings. Chelsea comes out to offense +0.12 / defense -0.24 and West Ham is offense -0.38 / -0.24. These calculations are the difference between my predicted results and the league average results. To now give a rough handicapping number let’s start with Chelsea. Here I take the league average 1.38 add their offense rating of +0.12 and West Ham’s defense rating of -0.24 and get Chelsea predicted at 1.26 goals. For West Ham I also take 1.38 add their offense rating -0.38 and Chelsea defense rating -0.14 and get West Ham 0.86 goals.
From here it’s a good idea to normalize the data (revert to the mean). I do this by averaging the predicted goals calculated above with the league average of 1.38. This is Chelsea (1.26+1.38)/2=1.32 goals and West Ham (0.86+1.38)/2=1.12. This gives me a prediction of 2.44 goals scored in this game.
Bookmakers take wagers in half point increments. As I’ve predicted 2.44 and am betting over/under 2.5 I need to use a distribution model. For this Poisson distribution can give a rough figure. Poisson can be calculated in a Microsoft Excel spreadsheet using the syntax: =POISSON(x, mu, cumulative). To explain:
- x is the number we’re solving for, in this case 2.5
- mu is the our calculated expectation, in this case 2.44
- cumulative is asking if we’re solving for at least x as opposed to exactly x. In this case we are so we enter true.
Having this data I now open an Excel spread sheet and inside an empty cell type =POISSON(2.5, 2.44, true) to discover this solves to 0.5593 which means I’m expecting this to go under 2.5 goals 55.93% of the time. This leaves 44.07% of the time it’s expected to go over. In this game I found 188Bet was offering -120 ($12 to win $10) on under 2.5. Odds -120 carries a required break even rate of 54.55%. Our calculation is we expect to win this wager 55.93% of the time. This suggests this would be a +EV bet, however this handicapping method is too simple to be profitable and adjustments are often required.

Poisson distribution is one of the most important factors involved in pricing various sports
In this match Chelsea was a considerable favorite. When one team is a large favorite it is more likely the first goal comes sooner than expected which will increase the pace of the game. By how much it increases requires deeper analysis. Also looking at injuries, suspensions, lineup changes and how these are expected to affect the game are critical adjustments too. Also looking at strength of schedule is another aspect. There are all sorts of adjustments to make in deciding which side is the better bet. Whilst it doesn’t matter to the analysis for those curious I will note Chelsea lost this game 3-1 which was an upset of a decent magnitude.
Handicapping NLF Totals
Similar methods to the one I just used can be employed as a base for handicapping totals of many sports, and each has its own intricacies for making adjustments. Baseball is however different where the pitchers are a major factor and the batting line up, bullpen and even umpires make a difference. The one that is the most unique however is American football.
 In American football we cannot use Poisson distribution. This is because points are not scored one at a time – Touchdown is 7 (on average this is true, ignoring extra point and two point conversion is almost fine), Field Goals are 3, and rare safeties are 2 points. The most important aspect to NFL football totals is push frequency. As shown in the NFL totals push chart to the right, certain totals occur much more often than others. Even though each season the average points scored in a game is often around 43, the most common total scores are 37 and 41.
Understand the chart I provided is a push chart. This does not reflect the probability of any given game scoring the number of points illustrated but rather games with totals near that range. For example a game with a total set at 36.5 will score exactly 37 closer to 4.63% of the time than a game with a total of 44.
Knowing these key numbers for NFL totals and having the push frequencies handy makes shopping different totals much easier. For example if one bookmaker has over 40.5 -120 and another has over 41.5 +100 you can use this information to determine which option is the better bet. The “how to” is exactly as covered in my article on point spread betting.